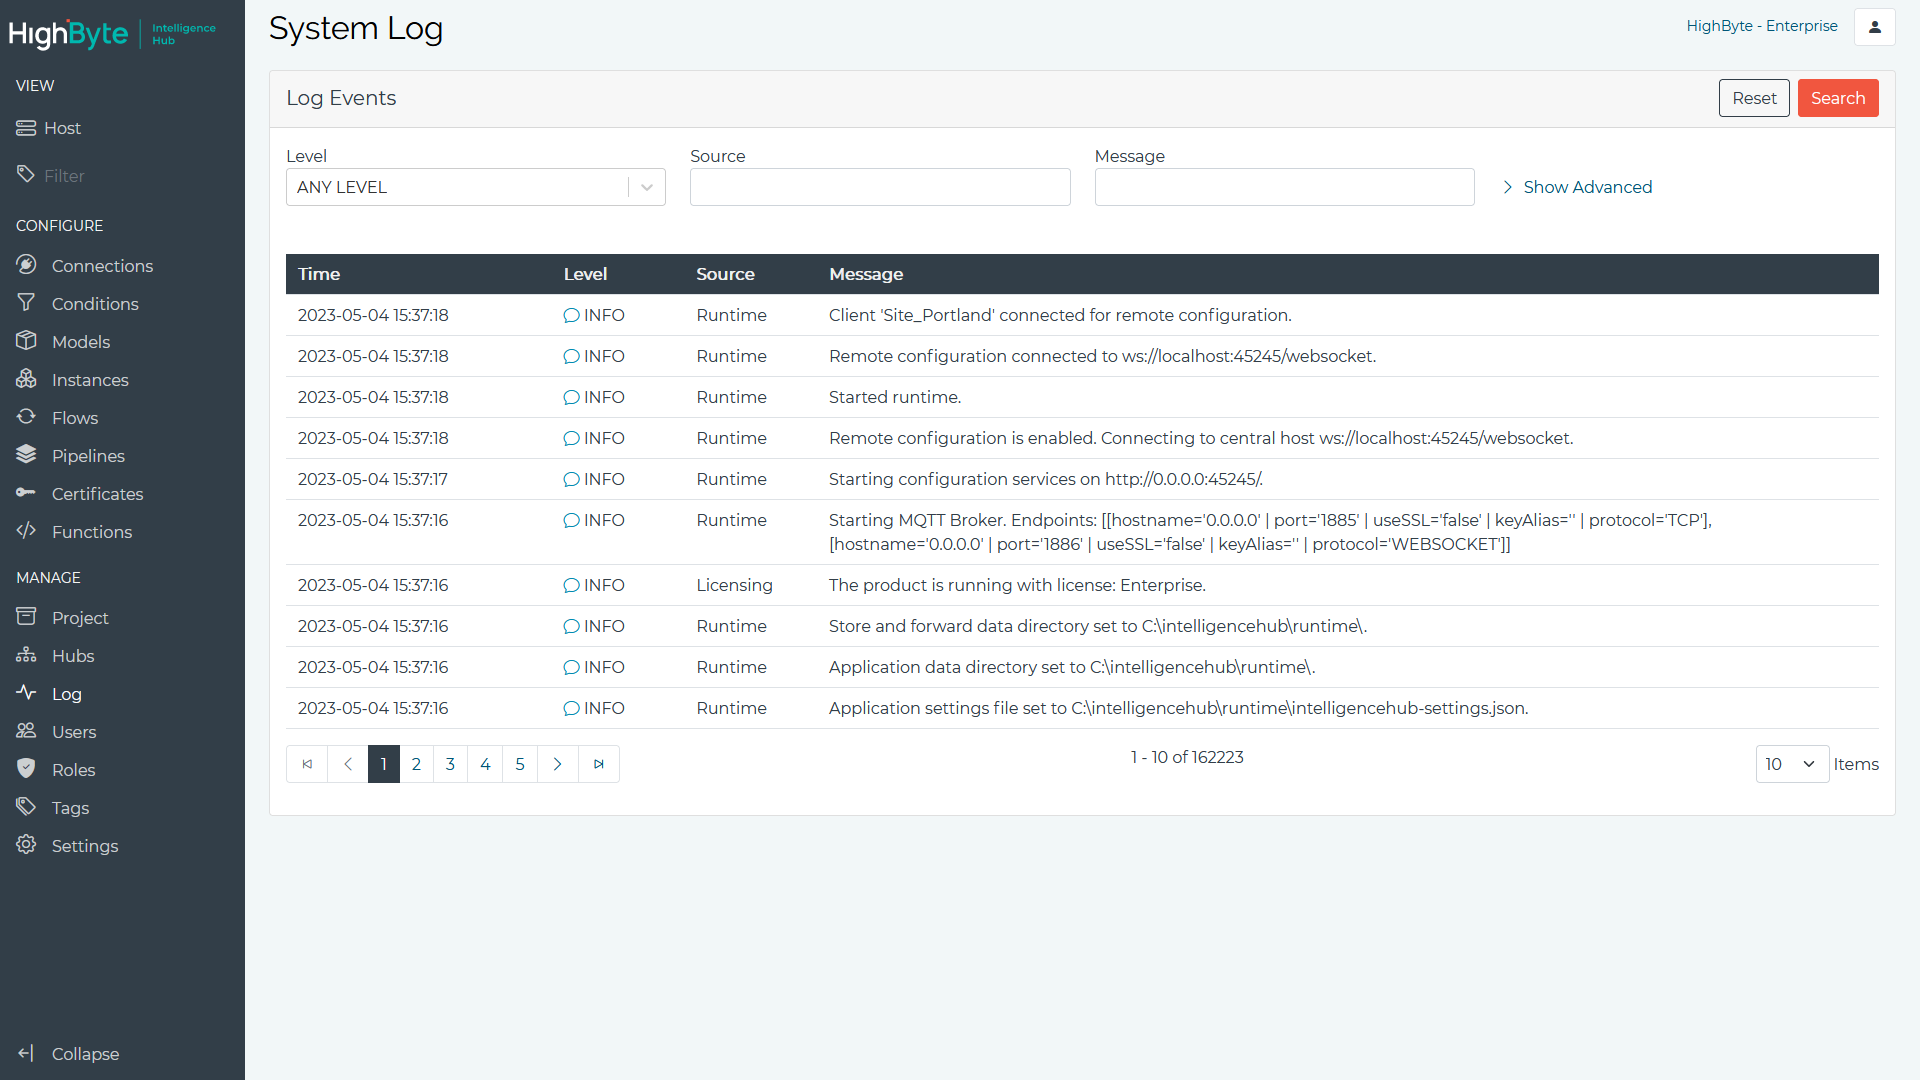
Event Log
The Event Log is available via the main menu under Log and contains the runtime and audit log messages generated by the selected hub. The log is primarily used for troubleshooting connection and flow errors.

Each log message includes the time (localized), the event level (e.g., info, warning, error, fatal, or audit), the source (the Runtime or a Connector), and the message that can be used for troubleshooting.
The log can easily be searched by the Level, Source, or a general filter that looks at the message body.
A text-based version of the log is also available in the
intelligencehub-events.log file (located in the application data
directory). Each log message in the text file is in JSON format,
allowing for external log monitoring tools to easily consume and
index the messages.
Custom Event Messages
It’s common to use applications like Splunk or DataDog to monitor the text based log to detect errors. In these cases it can be useful to create custom
log messages, based on specific logic you are monitoring. {{System.EventLog.Info}} can be used as a Flow or Pipeline output source to write messages to the log. Format the writes as
a string value.
As an example, a flow can monitor the number of errors on a given set of flows and write to the logs if the number of errors exceeds 10.