Status & Metrics
The Intelligence Hub provides visual feedback of the status of Connections, Flows, and Pipelines and also makes this status information and performance metrics available as source data in the system. This allows for triggering using status and metric changes, as well as making this data available to monitoring applications.
This section covers the status and metric information available for each object.
Connection Status
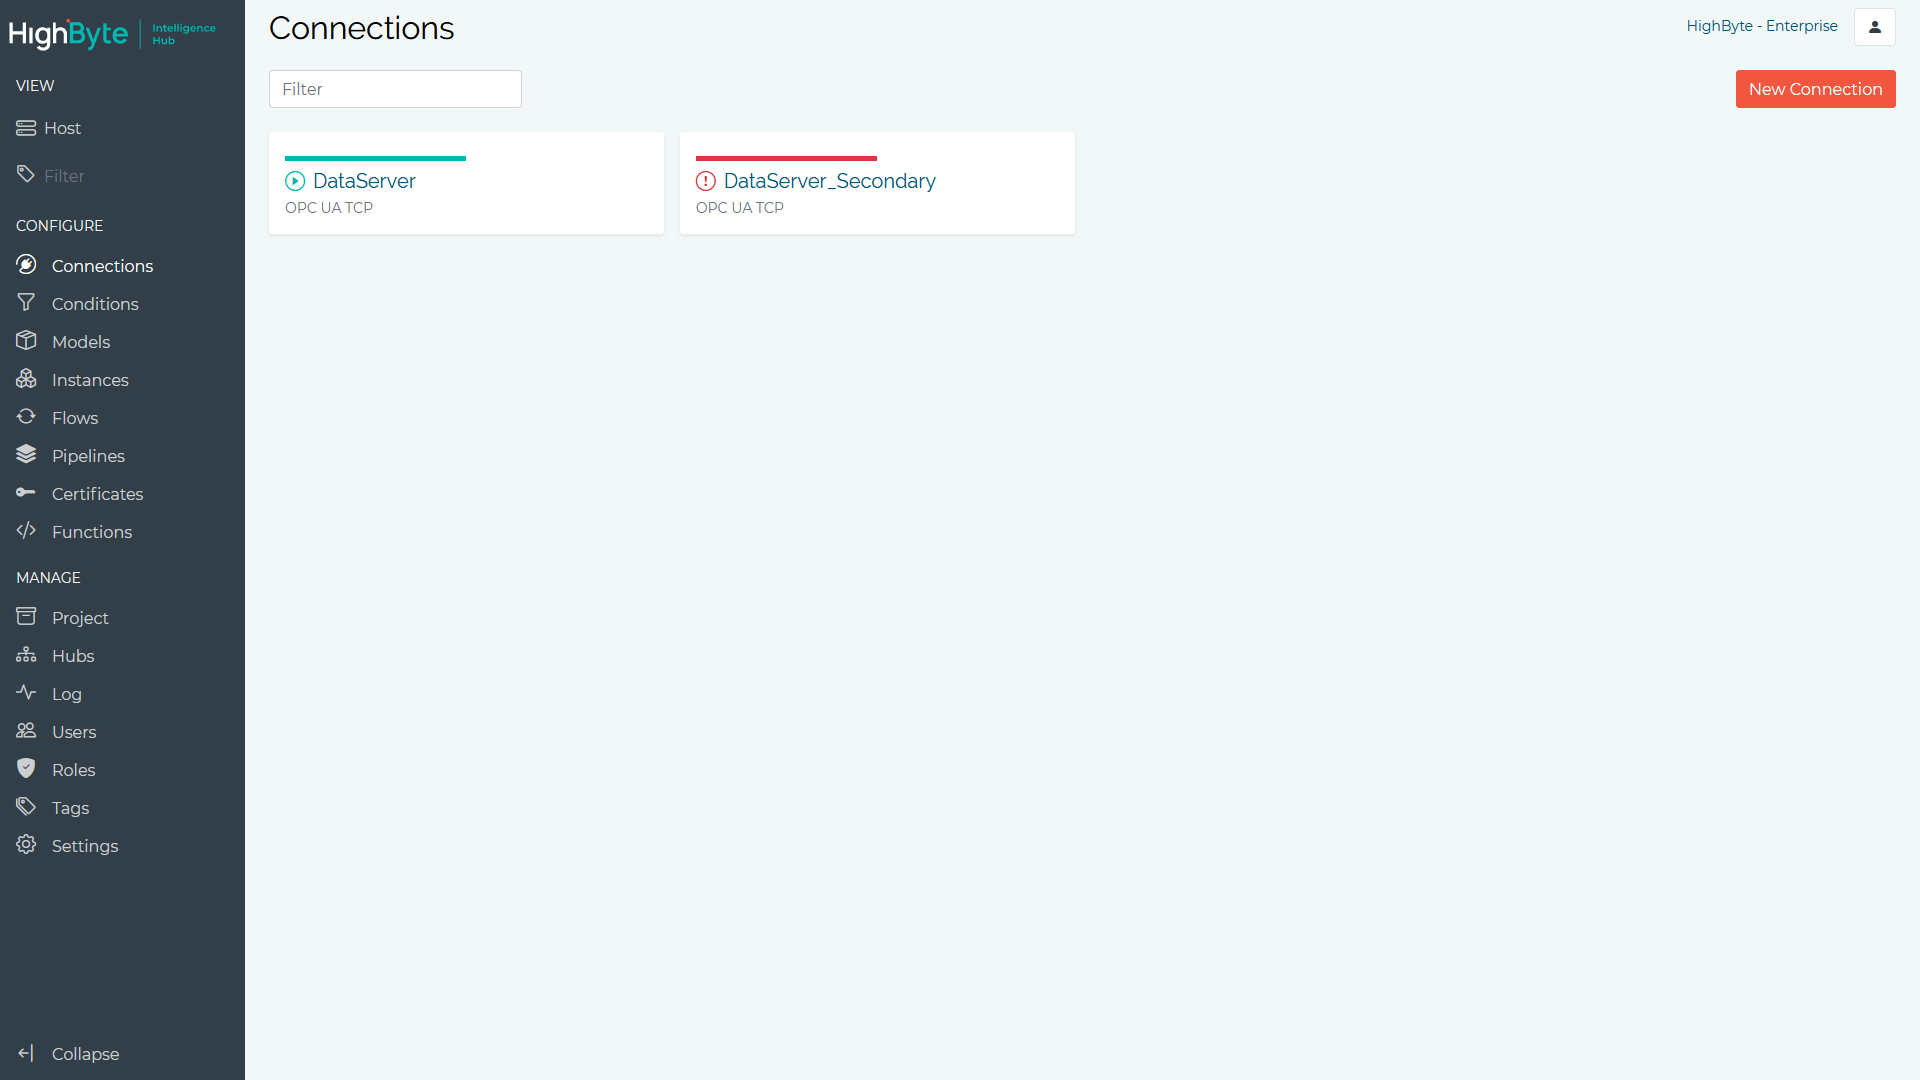
Connection status is reported through the main Connections view, as well as on the Details tab for each connection.

A Connection’s status is set to Good when the connection is successfully established. Note: Some connection types, like file connections are always Good as there is no physical connection.
A Connection’s status is set to Bad when the connection is not successfully established (e.g., MQTT server cannot be reached, HTTP server is not available or authentication fails).
The Connection status also shows the last error message for the Connection. When a connection transitions from a Bad state to Good state a message is logged to the event log. Select the Log menu option to view more details on the error.
Connections expose status and metric information under the System.Connections.<connectionName> reference. Below is the information exposed for each connection.
| Metric | Description |
|---|---|
| name | The name of the connection. |
| lastError | The last error message produced by the connection. |
| healthy | True if the connection is in a good state, false if it’s in an error state. |
| storeAndForwardEnabled | True/False if store and forward is enabled for the Connection. |
| status | The status string of the connection (Good or Bad). |
| statistics.pendingWrites | The number of writes queued to send. When Store & Forward is enabled, this shows how many writes are pending to send. |
| statistics.droppedWrites | In the event that the write queue fills up for in memory or store and forward, and new writes are dropped, this metric is a count of how many writes are dropped since the last time the connection was established. |
| statistics.outputs | An array of all the outputs and the pending and dropped writes for each output. |
Flow Status
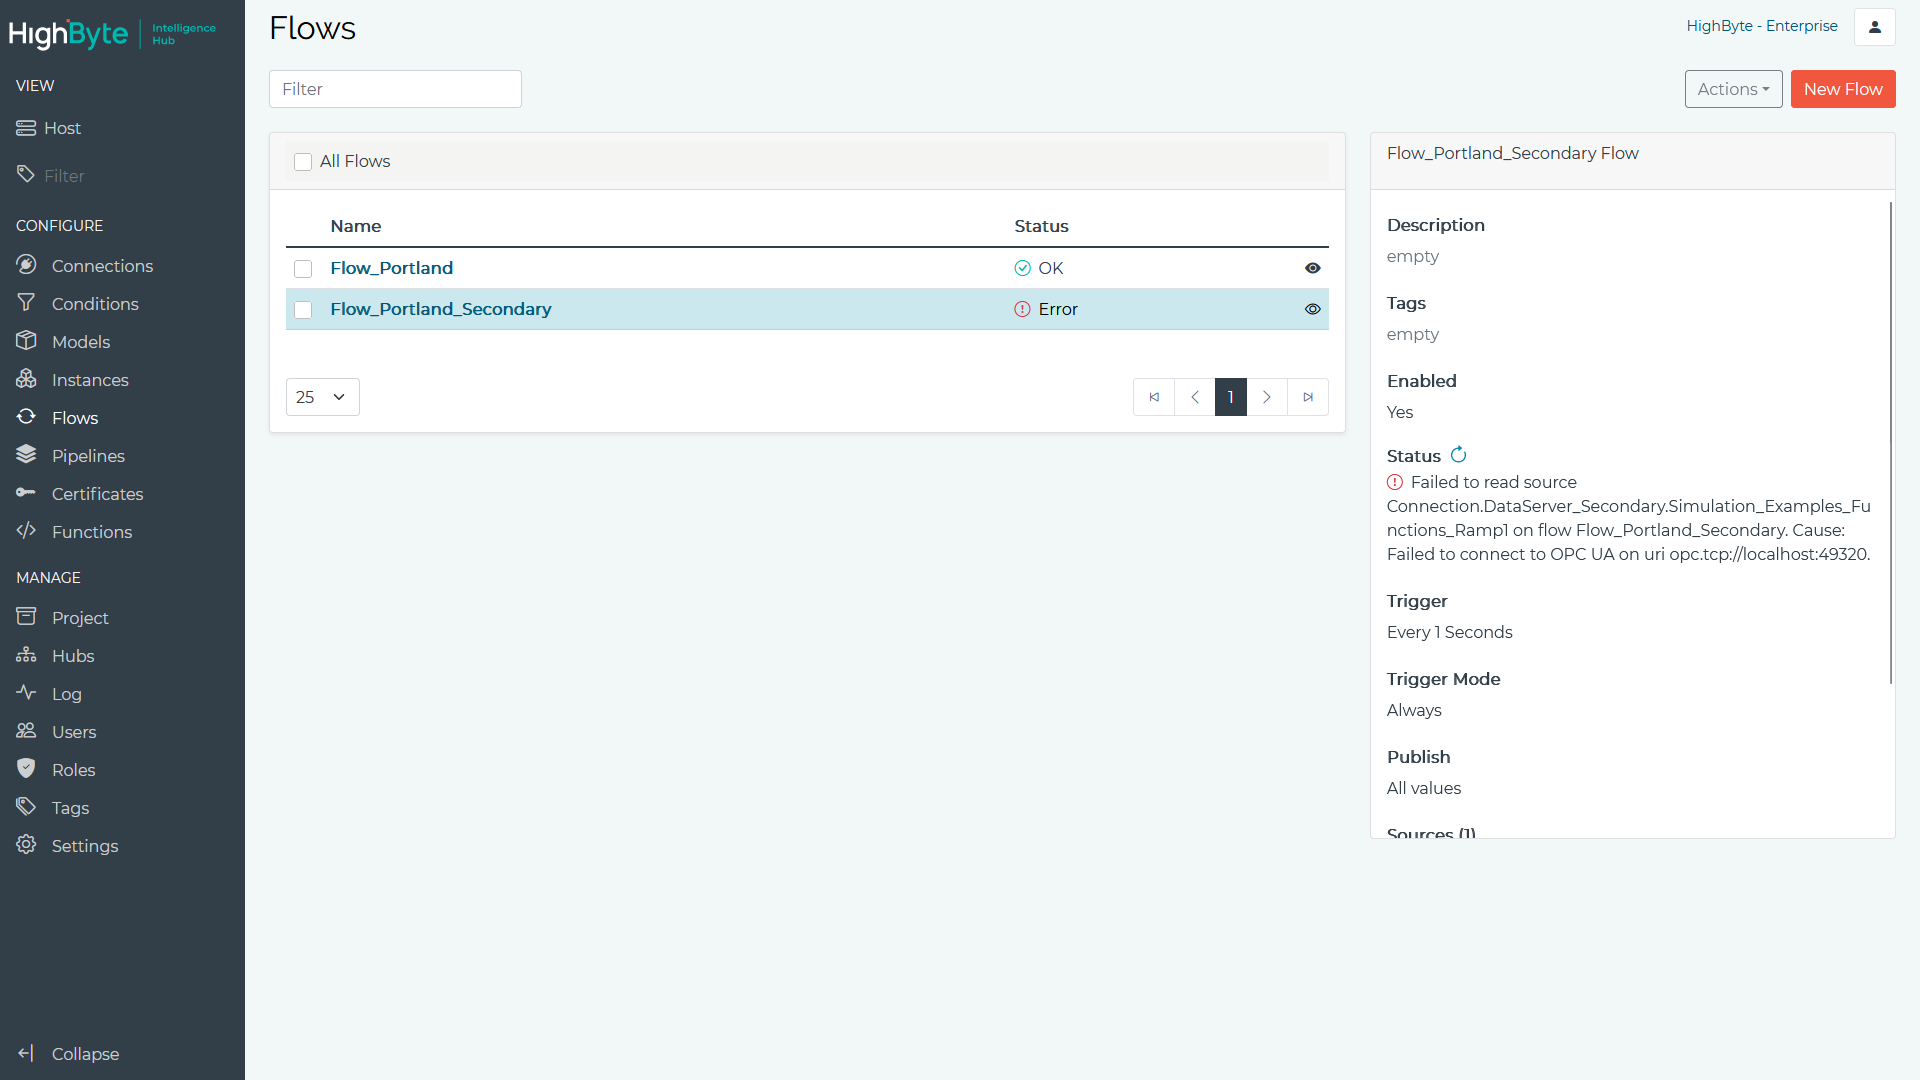
Flow status is reported through the main Flow view, as well as on the Details for each Flow.

Flow status includes the enabled state of the Flow, the status of the Flow (Good or Bad) and the last error message.
A Flow’s status is set to Good if all of its sources have been successfully read and written to all of its targets.
A Flow’s status is set to Bad if there is a failure on any of its sources or targets. The last error message shows the highest priority error on the flow. Select the Log menu option to view more details on the error.
Flow status and metric information is available under the System.Flows.<flowName> reference. Below is the information exposed for each flow.
| Metric | Description |
|---|---|
| name | The name of the flow. |
| lastError | The last error message produced by the flow. |
| healthy | True if the flow is in a good state, false if it’s in an error state. |
| enabled | True if the flow is enabled. |
| statistics.totalExecutionCount | Total number of times the flow has run. |
| statistics.lastCompleteTime | The last time the flow completed, in ISO8601/UTC format. |
| statistics.executingTimes | This is the time spent by the flow issuing reads to sources, running conditions, and building instances for output. Writes in flows are asynchronous, so this time does not include how long it takes for writes to complete. Min, Max, and Mean times are provided over the last 10 flow runs. |
| statistics.waitingTimes | This is how long the flow waits to run again. For flows in Polled mode the waiting time statistics correlate with the interval. For flows in Event mode the waiting time statistics correlate to the time between trigger events. |
Pipeline Status
Pipeline status is reported through the Status and Replay tools in the Pipeline Graph.

Like Flow and Connection Status, Pipeline Status includes Good/Bad status, last error messages etc. In addition to that, Pipelines also provide the same status information for each Stage.
A Pipeline is in an error state if any of its Stages were in an error state on the last Execution of the Pipeline, and in Good status if there were no errors on the last execution.
A Pipeline Stage is in an error state if any event produced an error in the last Execution of the pipeline. Previous executions can be inspected in detail using the Replay tool.
Pipeline/Stage status and metric information is available under the System.Pipelines.<pipelineName> reference. Below is the information exposed for each pipeline.
| Metric | Description |
|---|---|
| name | The name of the pipeline. |
| lastError | The last error message produced by the pipeline. |
| state | Good or Bad. |
| healthy | True if the connection is in a good state, false if it’s in an error state. |
| status | The status string of the connection (Good or Bad). |
| stageStatus | An array of the status objects for each stage. See below table for details. |
| statistics | An object with statistics for the pipeline executions. See below table for details |
| Stage Status Metric | Description |
|---|---|
| name | The name of the stage. |
| lastError | The last error message produced by the stage. |
| pipelineName | The name of the parent pipeline. |
| state | Good or Bad. |
| healthy | True if the connection is in a good state, false if it’s in an error state. |
| Pipeline Statistics | Description |
|---|---|
| idle | True if the pipeline is not processing any events. False otherwise. |
| totalRuns | The total number of events processed by the pipeline |
| totalErrors | The total number of pipeline execution errors. |
| queuedWrites | The number of writes waiting to be processed by the pipeline. |
| lastCompleteTime | The last time the pipeline completed processing an event. |
| executingSamples | An object containing the mean, min, max, standard deviation, and sample count. (since the last time the pipeline was saved) |
| waitingSamples | An object containing the mean, min, max, standard deviation, and sample count. (since the last time the pipeline was saved) |
| stages | An array that contains statistics for each of the pipeline’s stages. See below table for details. |
| Stage Statistics | Description |
|---|---|
| stageName | The name of the stage. |
| totalRuns | The total number of events processed by the stage. |
| totalErrors | The total number of stage event errors. |
| lastCompleteTime | The last time the stage completed processing an event. |
| executingSamples | An object containing the mean, min, max, standard deviation, sample count. (since the last time the pipeline was saved) |
Internal Sources
The hub also exposes internal sources that are not linked to configuration objects. These are available under the System.Internal.<name> reference and described below.
| Internal Source | Description |
|---|---|
| DateTime | The current UTC time of the server in ISO8601 UTC format. |